Aimin Cao, Barbara Romanowicz, Nozomu Takeuchi
5 minute read
RESEARCH-PAPERS
We document a high signal to noise phase that agrees with theoretical predictions for PKJKP. Envelope modeling of the PKJKP waveform implies a slightly larger shear velocity gradient with depth in the inner core than that in PREM model.
Abstract
The seismic phase PKJKP, which traverses the inner core as a shear wave, and would provide direct evidence for its solidity, has been difficult to detect. Using stacked broadband records from the Gra”fenberg array in Germany, we document a high signal to noise phase, whose arrival time and slowness agree with theoretical predictions for PKJKP. The back-azimuth of this arrival is also consistent with predictions for PKJKP as is the comparison with a pseudo-liquid inner core model. Envelope modeling of the PKJKP waveform implies a slightly larger shear velocity gradient with depth in the inner core than that in PREM model.
Figures
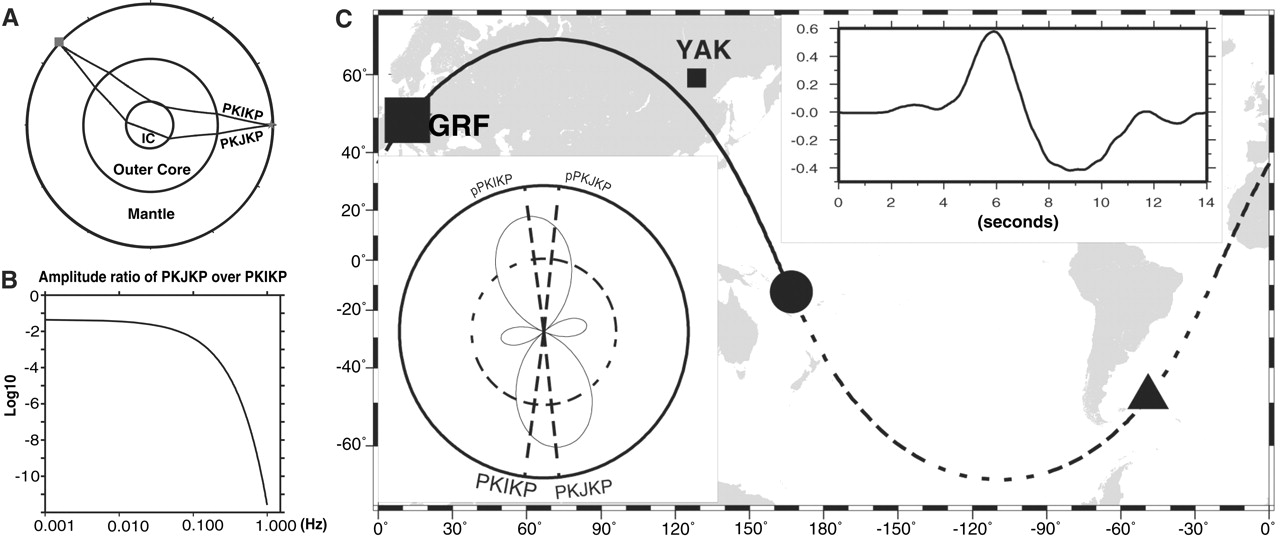
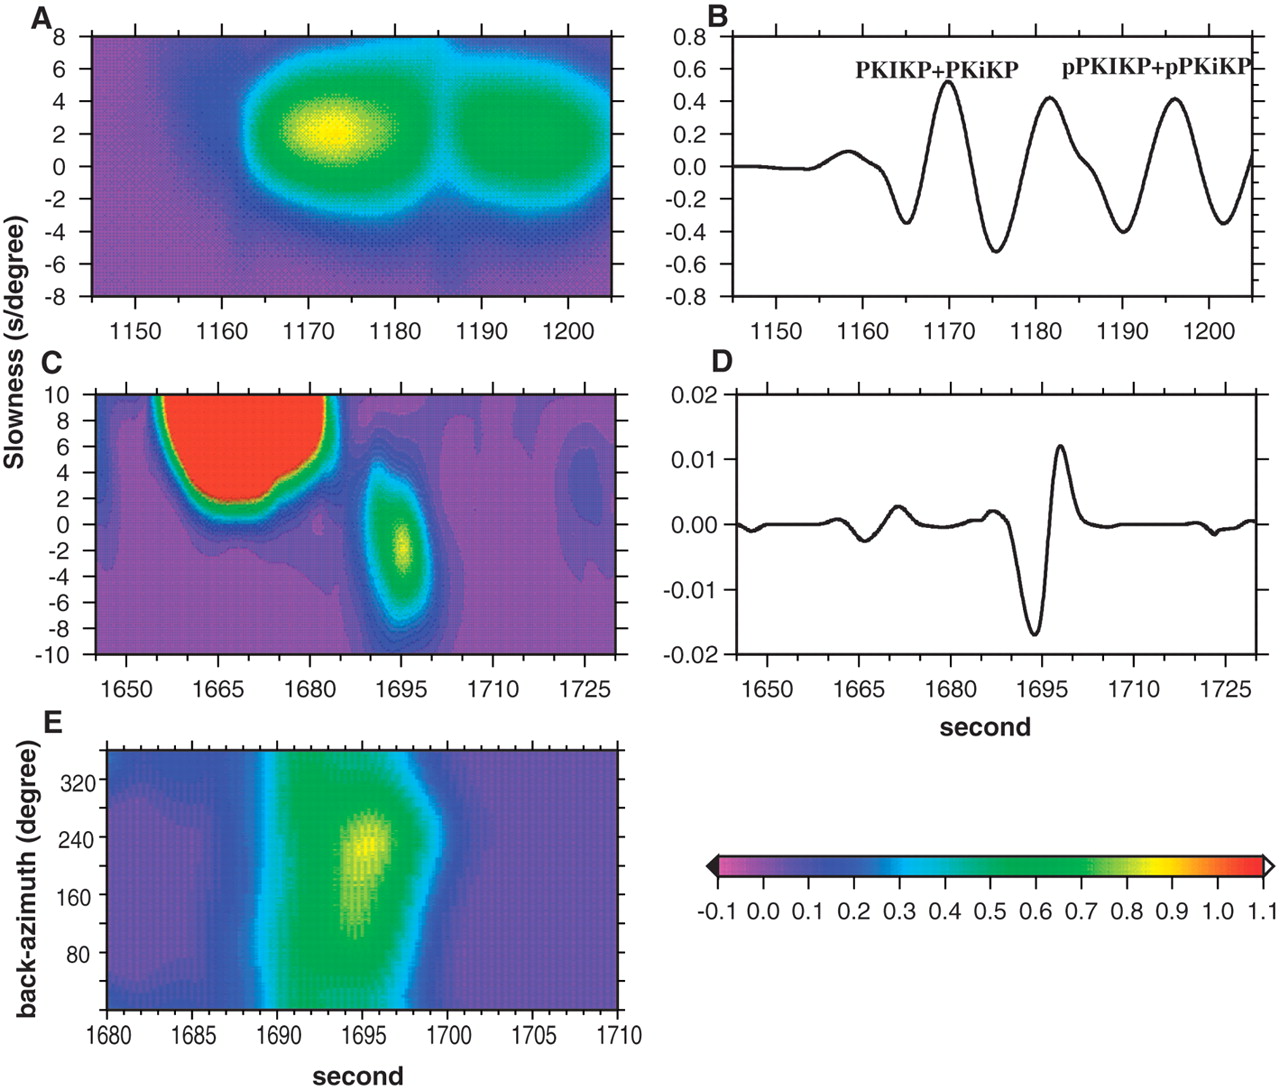
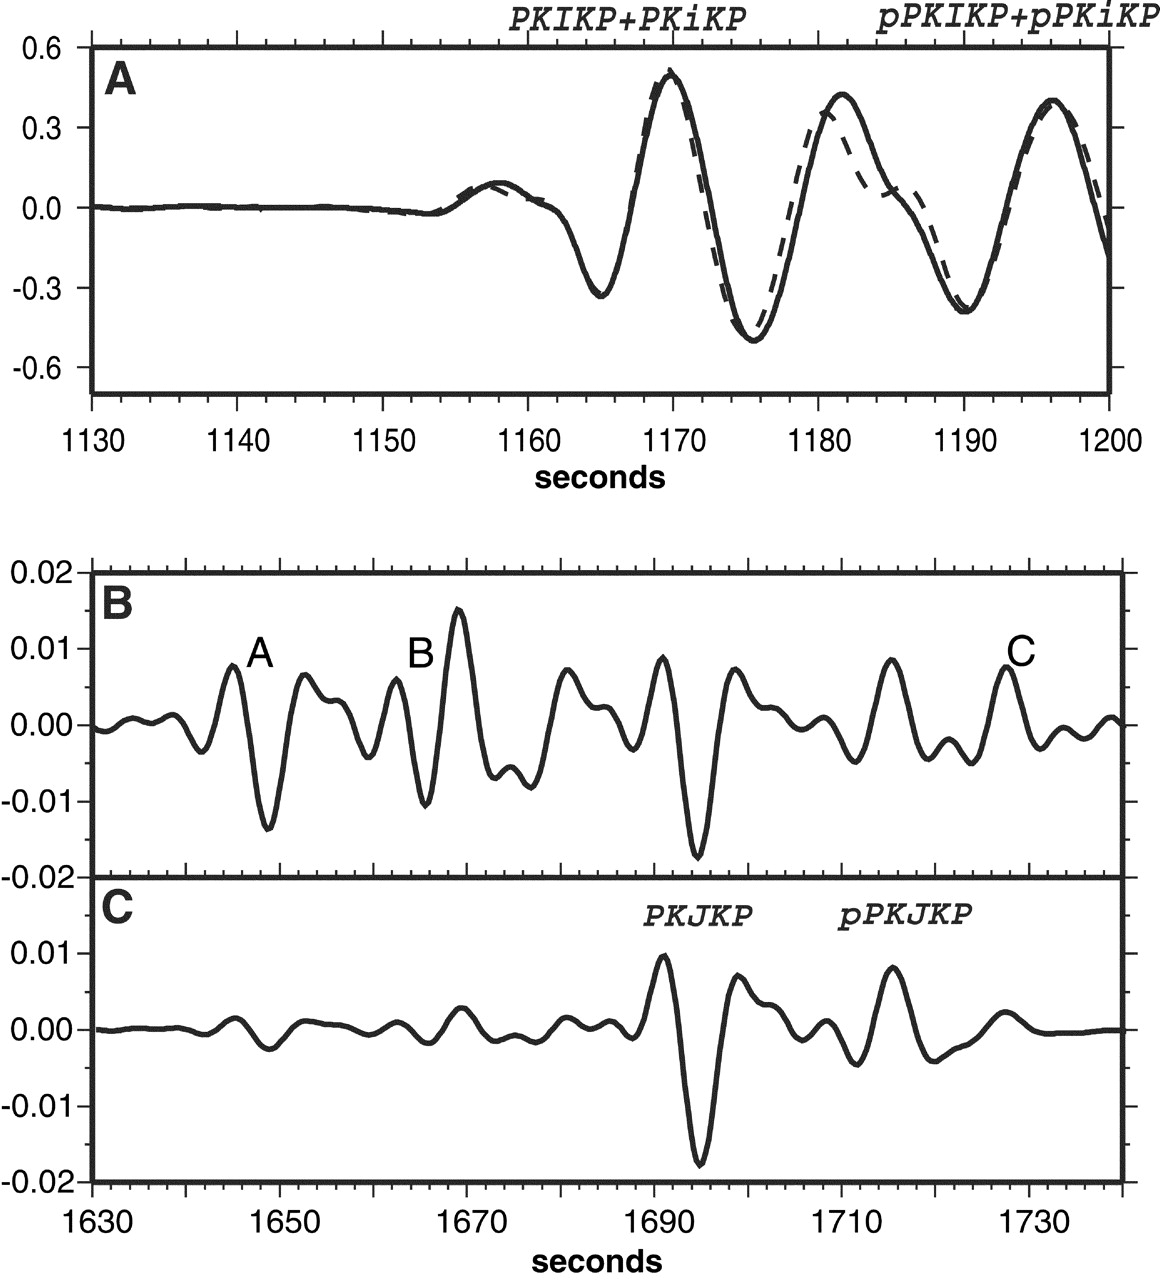
Fig. 1. (A) Ray paths of PKJKP and PKIKP. The point on the right and square on the left indicate the source and GRF array locations, respectively. IC, inner core. (B) The theoretical amplitude ratio of PKJKP over PKIKP as a function of frequency based on the reference model PREM (7), after correcting for transmission and geometrical spreading (16). The reference epicentral distance is 138°. Given the dynamic range of present seismometers, it is unlikely that one could observe PKJKP (or pPKJKP) in the frequency range ∼1.0 Hz (4). (C) Geographical setting of the event (dot) and GRF seismic array (square). The solid line is the ray path of PKIKP and the dashed line is the ray path of PKJKP projected on Earth's surface. The triangle marks the location of the bottoming point of PKJKP in the inner core. The upper right inset shows the source-time history of the event characterized by a P phase recorded at a broadband station (YAK, distance = 80.1°) of the Global Seismographic Network, located in a similar azimuth as GRF. The lower left inset illustrates the P-wave radiation pattern in the vertical plane of the great circle. This event is exceptional: (i) The source duration is less than 9 s; (ii) the expected PKJKP is emitted from the top of the lobe of the P-wave radiation pattern; and (iii) the potential interfering phases identified in previous studies (4, 5), such as PcPPKIKP, pPcPPKIKP, sPcPPKIKP, and PKKPdf, are at least 17 s away from the predicted PKJKP arrival time (according to PREM).Fig. 2. (A) Observed vespagram for PKIKP+PKiKP and their depth phases (the energy level is amplified 1.6 times). The center of the energy maximum is for a slowness of ∼1.9 s/degree, which is the average of slownesses of PKIKP (1.85 s/degree) and PKiKP (2.04 s/degree) predicted from PREM (7). The following weaker energy maximum corresponds to pPKIKP+pPKiKP and has the same slowness, as predicted from PREM. (B) Stacked waveforms for PKIKP+PKiKP and their depth phases for the energy maximum in (A). (C) Observed vespagram for the potential PKJKP (energy level is amplified 40 times). The slowness of the energy maximum is ∼ –1.6 s/degree, close to the PREM prediction of –1.43 s/degree. The arrival time is also compatible with PREM (1695 s for the maximum energy, compared with a prediction of 1690 s for the high-frequency onset of the pulse). (D) Stacked waveform corresponding to the energy maximum in (C). (E) Vespagram in the back azimuth and travel time domain. This shows the direction of arrival of the detected energy, which we identify as PKJKP, in the negative slowness range of (C). The estimated back azimuth is ∼223°, which shows that the observed energy propagates along the major arc from the source (the expected back azimuth of PKJKP is 218°). This indicates that the observed phase is not a near-array scattered phase and provides additional evidence for its identification as PKJKP. Fig. 3. Synthetic modeling. (A) Waveform modeling of PKIKP+PKiKP as well as pPKIKP+pPKiKP based on U.S. Geological Survey Preliminary Determination of Epicenters moment tensor. Both the observed (dashed line) and the synthetic (solid line) seismograms are normalized after applying the band-pass filter (0.06 to 0.1 Hz). Synthetics are obtained with DSM (12). (B) Synthetic differential seismogram for the PREM model compared with a true liquid inner core, for which the shearwave velocity is equal to zero. A (PcPPKIKP), B (pPcPPKIKP+sPcPPKIKP), and C (PKKPdf) are artificially enhanced by the assumption of liquid inner core. (C) Synthetic differential seismogram based on the pseudoliquid inner core used in this Report. We now can clearly see both PKJKP and pPKJKP phases. The amplitude of PKJKP is approximately 2.2 times as large as that of pPKJKP. Fig. 3. Synthetic vespagrams. (A) Pseudoliquid inner core model. Time windows are identical to those in Fig. 2C. Energy level is amplified 40 times, as in Fig. 2C. D, E, and F are crust, mantle, or outer core phases, and G is PcPPKIKP. See fig. S3 for a plot with energy level amplified only 20 times to bring out the relative strength of these phases. (B) Solid inner core model, assuming Qβ = 300. Because the strong mantle phase E in the synthetic model arrives at the same time as PKJKP, the dominant energy of phase E hides the much weaker PKJKP, which only slightly distorts the pattern of phase E. Likewise, pPKJKP slightly distorts the pattern of phase F. Phases E and F are not present in the observed stacks. Therefore, we cannot directly use the comparison of observed vespagram to that predicted by the solid inner core model; instead, we use a differential seismogram modeling approach, in which the energy from phases E and F is removed. (C) Synthetic differential vespagram in the slowness-time domain. This vespagram is calculated for the solid inner core minus the pseudoliquid inner core models. The time window is the same as that in Fig. 3C. The estimated slownesses of the energy maxima are both –1.4 s/degree, as are the predictions based on PREM. This identifies the two phases in the differential seismogram (Fig. 3C) as PKJKP and pPKJKP.
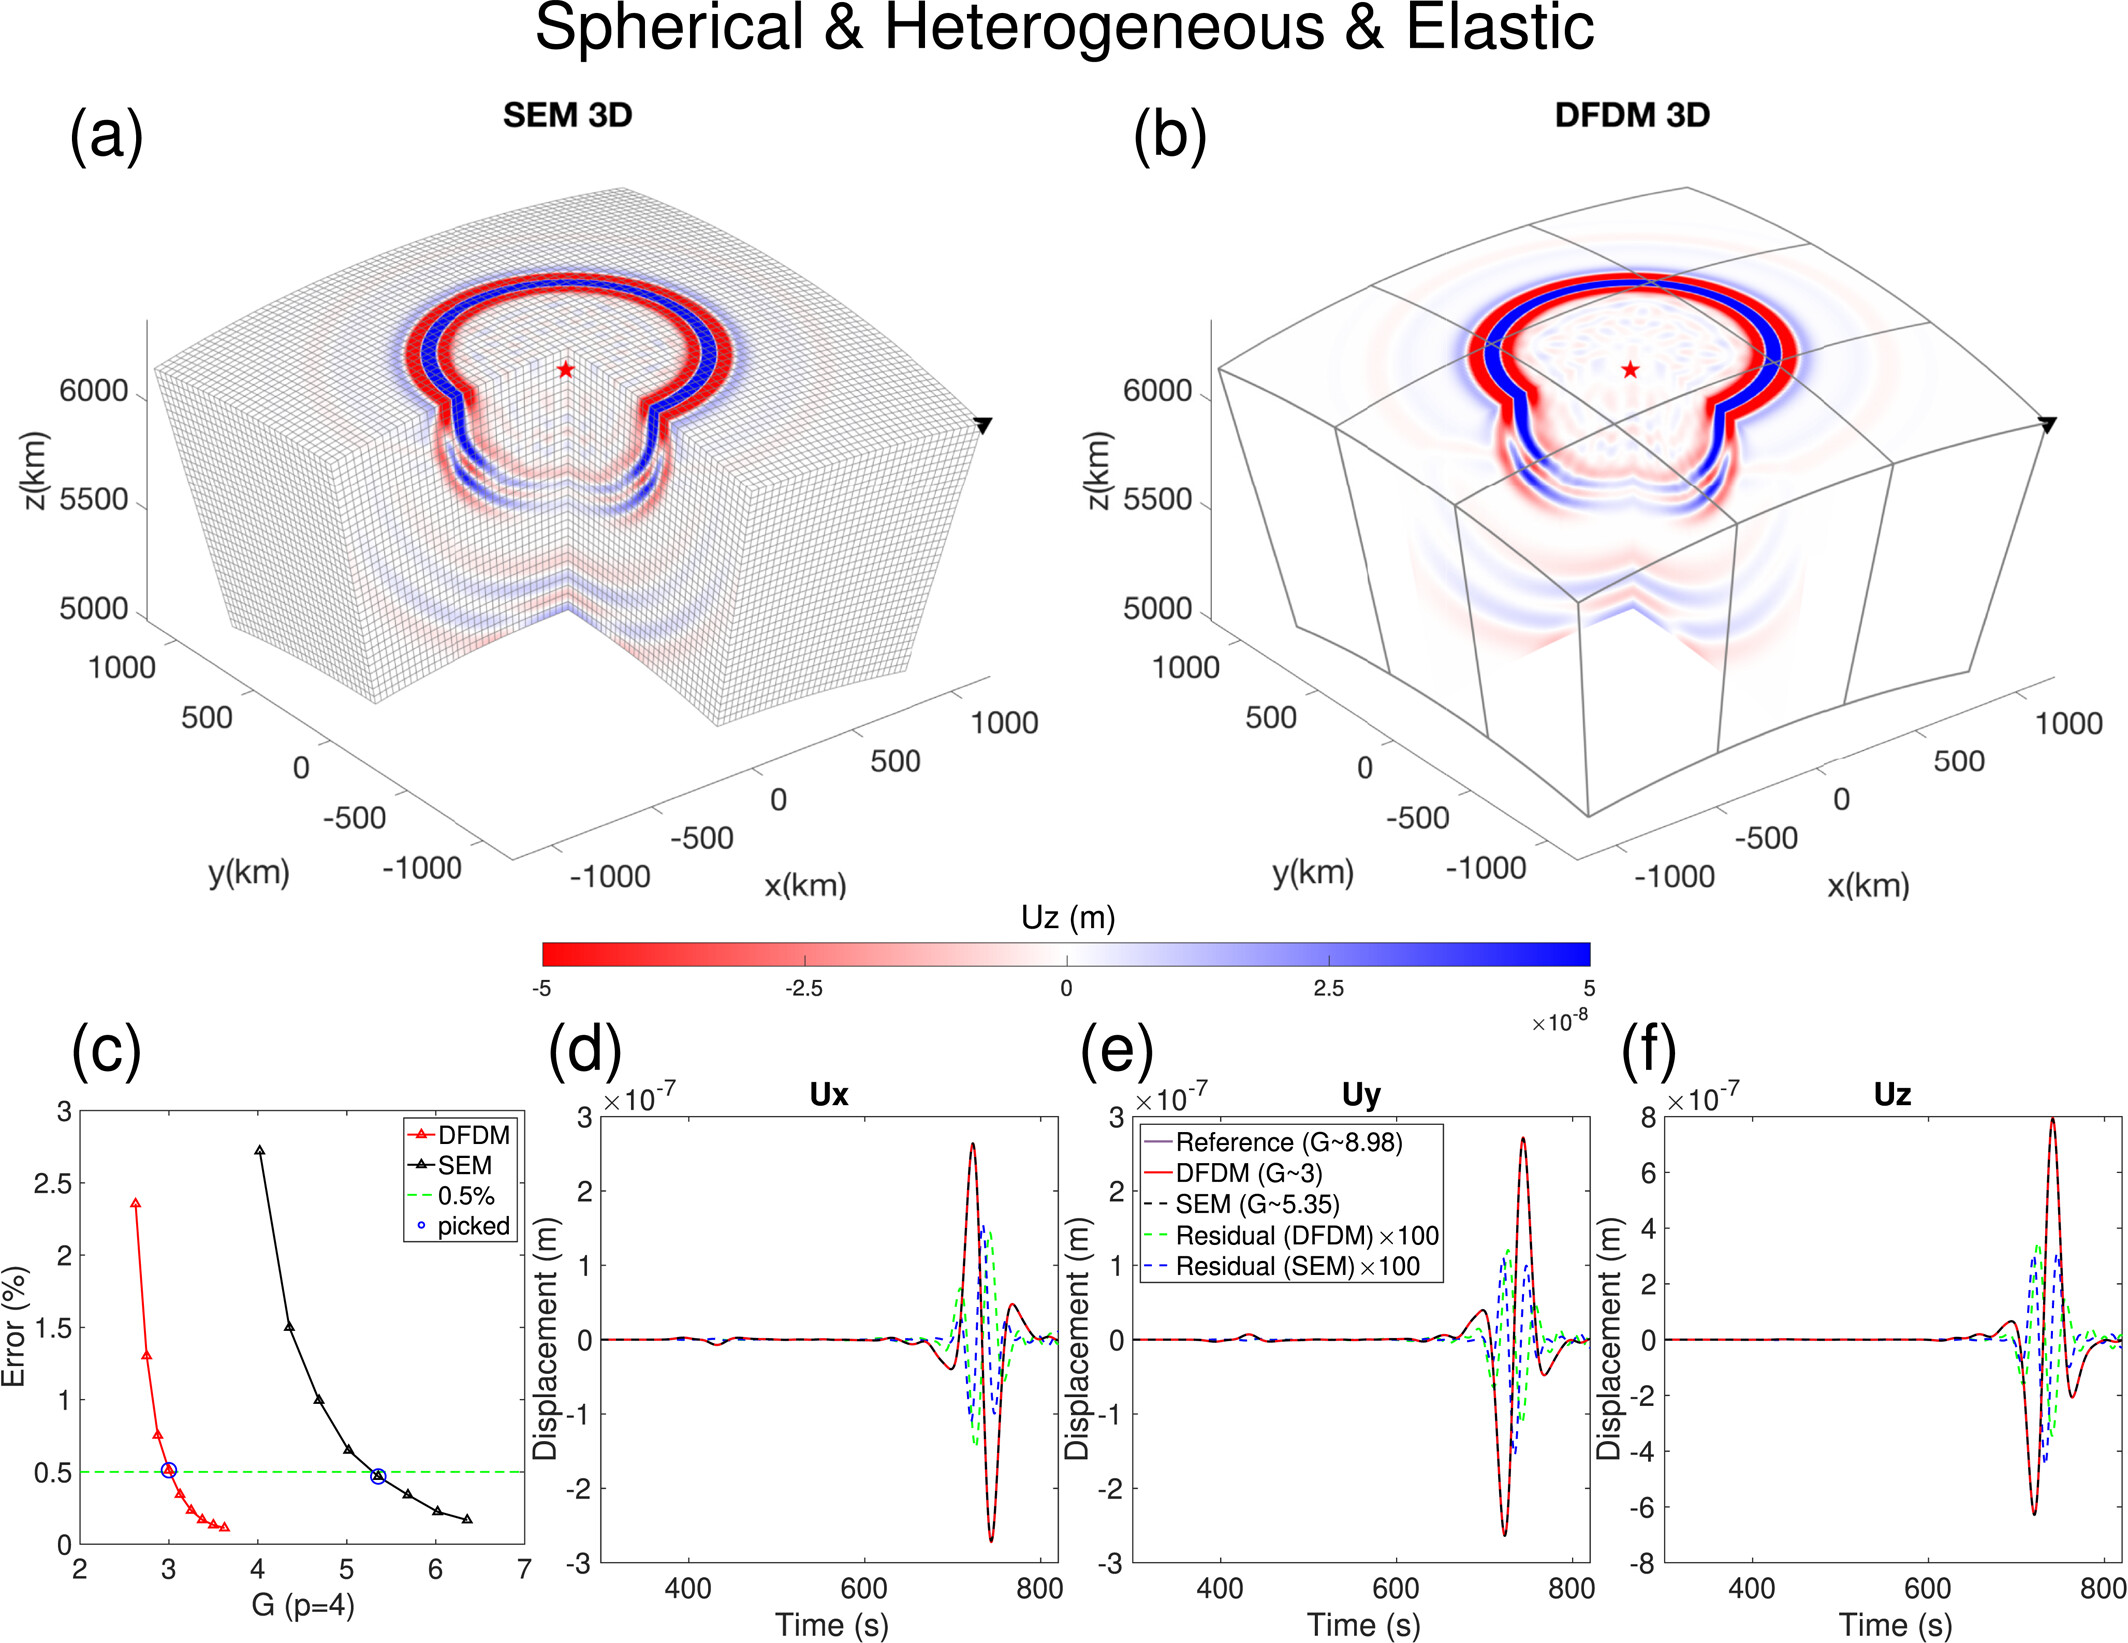
We implement the distributional finite difference method for 3D seismic wave propagation, which show promise for improving accuracy, flexibility, and efficie...
Daniel A. Frost, Marine Lasbleis, Brian Chandler, Barbara Romanowicz
less than 1 minute read
research-papers
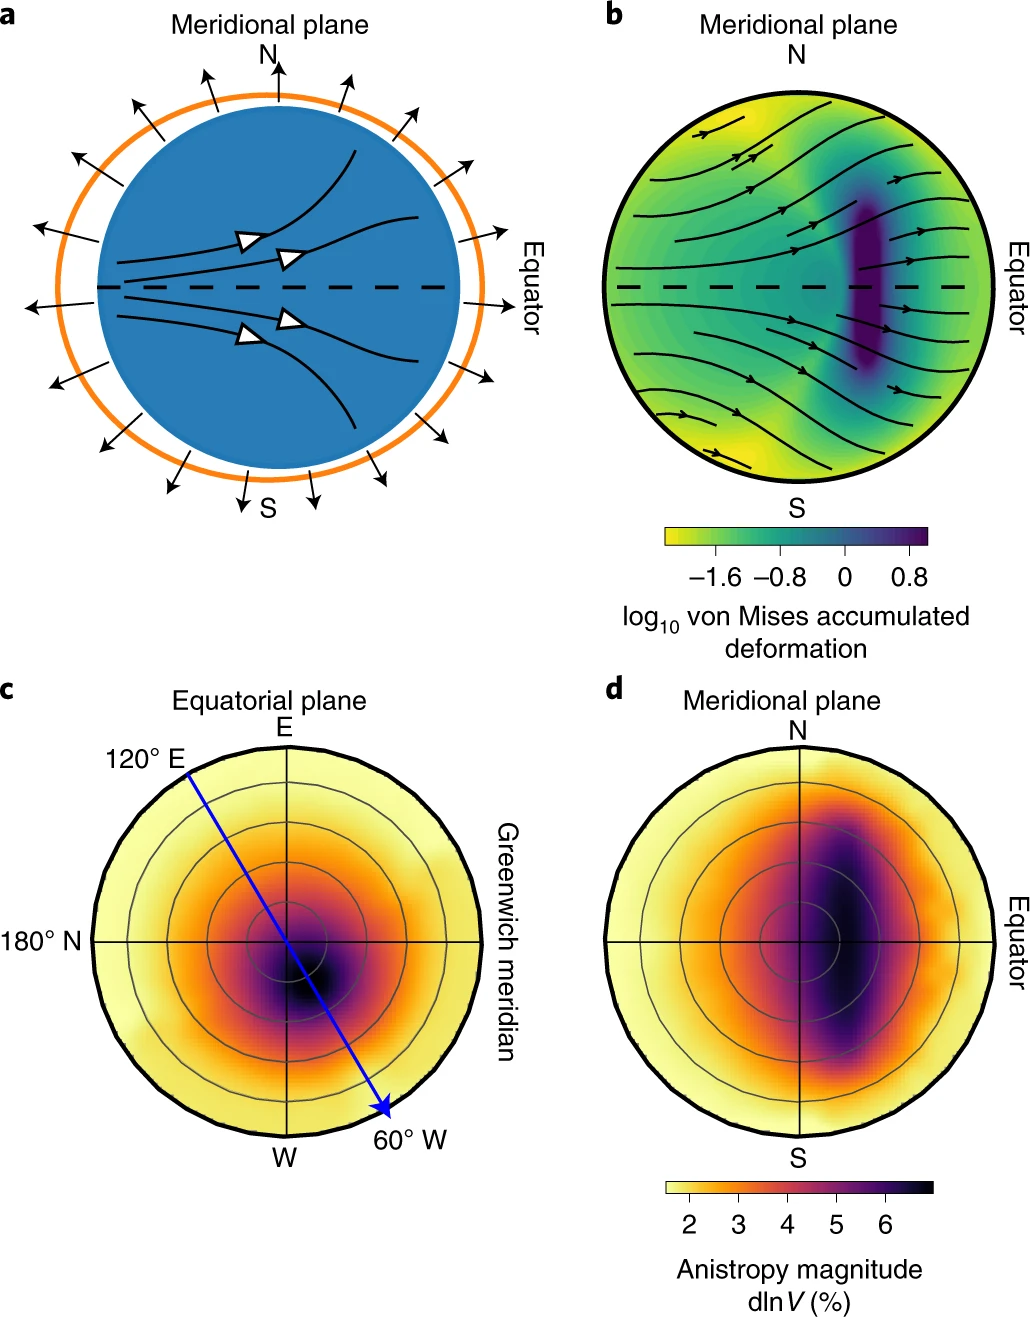
Progressive crystallisation of Earth’s inner core drives convection in the outer core and magnetic field generation. Determining the rate and pattern of inne...
Tutorial on how to use Git and GitHub for team collaboration on a project. Content includes installing, setting up, creating a repository, making commits, un...
Daniel A. Frost, Barbara Romanowicz
1 minute read
research-papers
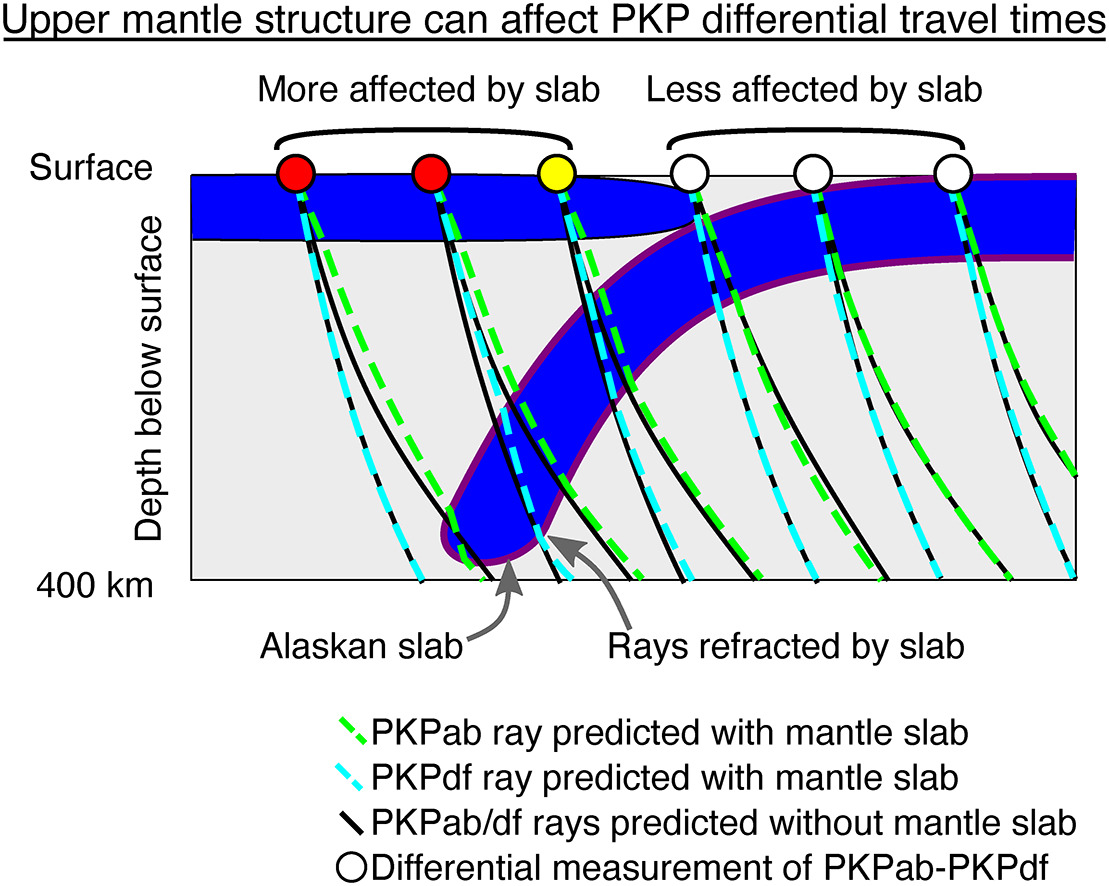
Using a regional tomographic model of the Alaskan upper mantle to predict upper mantle effects on PKP travel times, we show that the signature of the Alaska ...